Introduction
PyQwt is a set of Python bindings for the Qwt library featuring fast plotting of Python lists and tuples and the powerful multi-dimensional arrays provided by NumPy, the fundamental package for efficient scientific and engineering computing in Python. [1]
NumPy
The NumPy package extends Python with multi-dimensional arrays and a complete set of ‘standard’ functions and operators to manipulate the arrays. NumPy turns Python into is an ideal language experimental numerical and scientific computing (as powerful as APL, MatLab, IDL and others, but much more elegant).
If you do not have a mathematical background, you can think of a 1-dimensional array as a column in a spreadsheet. The spreadsheet lets you change whole columns element by element in one single statement. In a similar way, NumPy lets you change whole arrays element by element in one single statement as illustrated by the following snippet:
>>> import numpy as np
>>> x = np.arange(0.0, 10.0, 3.0)
>>> y = np.sin(x)
>>> x
array([ 0.,  3.,  6.,  9.])
>>> y
array([ 0.        ,  0.14112001, -0.2794155 ,  0.41211849])
>>> x*x
array([  0.,   9.,  36.,  81.])
The statement:
>>> np.arange(0.0, 10.0, 3.0)
returns a NumPy array of 4 equidistant points from 0 to 9 inclusive:
array([ 0., 3., 6., 9.])
The statements y = np.sin(x) and x*x show that NumPy arrays are manipulated element by element. All this in has been coded in C, for a manifold speedup with respect to pure Python.
You can think of a 2-dimension array as a spreadsheet: in both cases you you can operate on blocks, columns, rows, slices of colums, slices of rows or individual elements.
Want to learn more? Look at the Tentative NumPy Tutorial for a tutorial or at the Guide to NumPy for an advanced book.
Qwt
Qwt is a C++ library based on the Qt GUI framework. The Qwt library contains widgets useful for writing technical, scientific, and financial programs. It includes the following widgets:
- QwtCompass
- a very fancy QDial-like widget to display and control a direction.
- QwtCounter
- a QSpinBox-like widget to display and control a bounded floating point value.
- QwtDial
- a QDial-like widget to display and control a floating point value.
- QwtKnob
- a potentiometer-like widget to display and control a bounded floating point value.
- QwtPlot
- a widget to plot data in two dimensions.
- QwtSlider
- a QSlider-like widget to display and control a bounded floating point value.
- QwtThermo
- a thermometer-like widget to display a floating point value.
- QwtWheel
- a wheel-like widget with its axis parallel to the computer screen to control a floating point value over a very large range in very small steps.
See the Qwt manual for a complete overview of the Qwt library.
PyQwt with NumPy
PyQwt is mostly used to write graphical user interface applications. However, the following snippet shows how to use PyQwt in combination with NumPy from the command line interpreter. Line by line explanations follow the snippet:
>>> import numpy as np
>>> from PyQt4.Qt import *
>>> from PyQt4.Qwt5 import *
>>> from PyQt4.Qwt5.qplt import *
>>> application = QApplication([])
>>> x = np.arange(-2*np.pi, 2*np.pi, 0.01)
>>> p = Plot(
...  Curve(x, np.cos(x), Pen(Magenta, 2), "cos(x)"),
...  Curve(x, np.exp(x), Pen(Red), "exp(x)", Y2),
...  Axis(Y2, Log),
...  "PyQwt using Qwt-%s -- http://qwt.sf.net" % QWT_VERSION_STR)
>>> QPixmap.grabWidget(p).save('cli-plot-1.png', 'PNG')
True
>>> x = x[0:-1:10]
>>> p.plot(
...  Curve(x, np.cos(x-np.pi/4), Symbol(Circle, Yellow), "circle"),
...  Curve(x, np.cos(x+np.pi/4), Pen(Blue), Symbol(Square, Cyan), "square"))
>>> QPixmap.grabWidget(p).save('cli-plot-2.png', 'PNG')
True
The statements:
>>> import numpy as np
>>> from PyQt4.Qt import *
>>> from PyQt4.Qwt5 import *
>>> from PyQt4.Qwt5.qplt import *
import numpy, PyQt4, Qwt5 and qplt. The statement:
>>> application = QApplication([])
initializes and starts the Qt library so that it handles mouse movements, mouse button presses, and keyboard key presses. The statement:
>>> x = np.arange(-2*np.pi, 2*np.pi, 0.01)
creates an array with elements increasing from -2*np.pi to 2*np.pi in steps of 0.01. The statement:
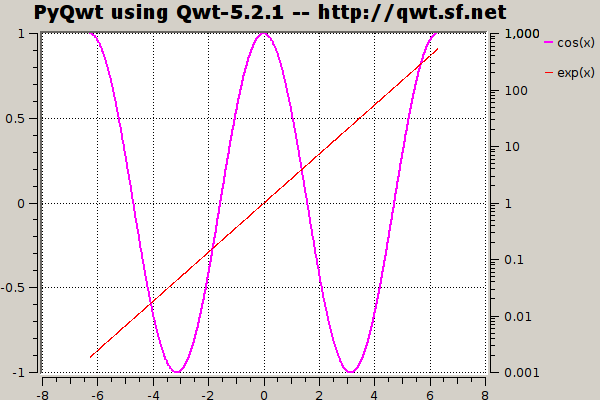
>>> p = Plot(
...  Curve(x, np.cos(x), Pen(Magenta, 2), "cos(x)"),
...  Curve(x, np.exp(x), Pen(Red), "exp(x)", Y2),
...  Axis(Y2, Log),
...  "PyQwt using Qwt-%s -- http://qwt.sf.net" % QWT_VERSION_STR)
creates and shows a plot widget with two curves and an additional right vertical logarithmic axis. The statement:
>>> QPixmap.grabWidget(p).save('cli-plot-1.png', 'PNG')
True
takes a snapshot of the plot widget and saves it into a file:

The statement:
>>> x = x[0:-1:10]
creates a new array from the old one by selecting every tenth element start from the index 0. The statement:
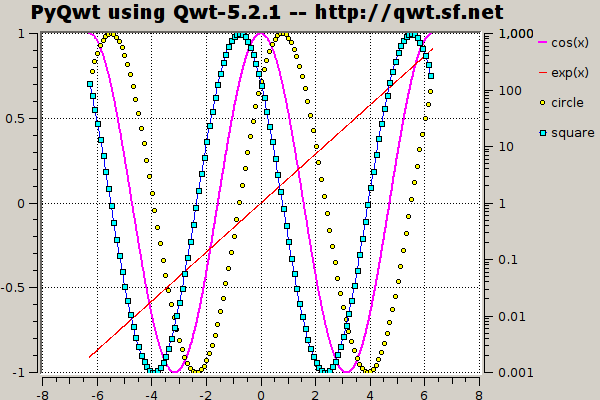
>>> p.plot(
...  Curve(x, np.cos(x-np.pi/4), Symbol(Circle, Yellow), "circle"),
...  Curve(x, np.cos(x+np.pi/4), Pen(Blue), Symbol(Square, Cyan),
...  "square"))
plots two new curves on the widget using the new array. The statement:
>>> QPixmap.grabWidget(p).save('cli-plot-2.png', 'PNG')
True
takes a snapshot of the plot widget and saves it into a file:

Getting help
PyQwt has a low volume mailing list to answer questions on installation problems and how to use the more advanced features. In particular, many of the more advanced examples using object oriented programming have been written to answer questions. Most questions help to improve PyQwt!
Please, subscribe to the mailing list before posting on the mailing list.
The mailing list is a subscribers only list and mail from non-subscribers is deferred to filter spam (more than 95 % of the mail by non-subscribers is spam and mail by non-subscribers is rejected).
The mailing list is configured to garantee anonimity as much as possible.
| [1] | The older numerical Python extension packages, numarray and Numeric are deprecated. |